TimeTrac Output - Stopped Execution, Case #1
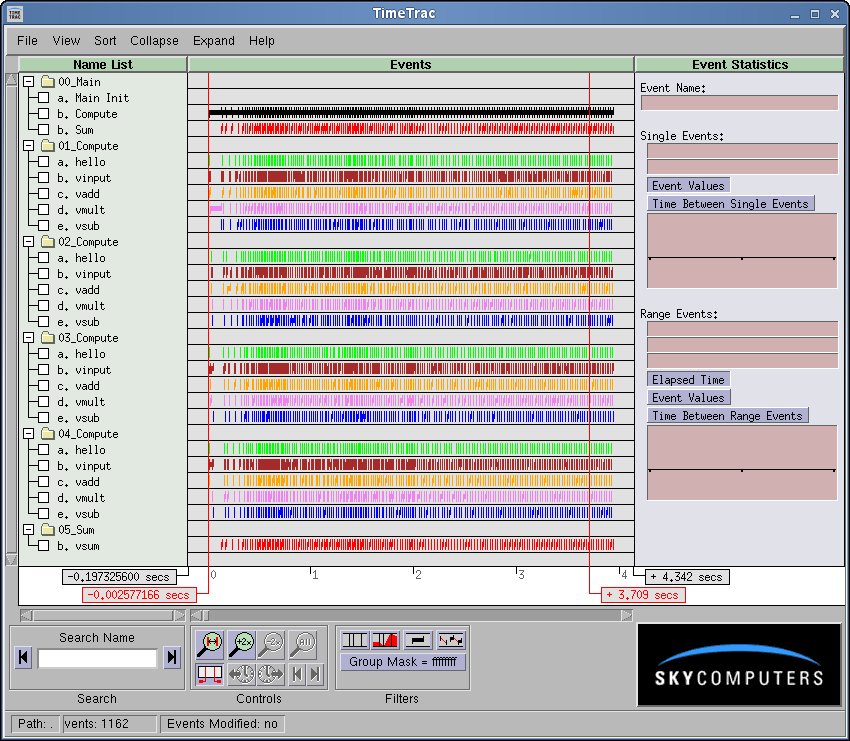
In this example, we have been running for a few seconds and the application stopped. The TimeTrac output appears as:

|
TimeTrac Event Examples |
This example uses a main thread to start the other threads consisting
of a group of compute threads, and a output
thread (vsum) to simulate a small application. There
is no I/O involved here; the vinput generates an input internally, vsum is
assumed to be the output.
Here we started the application and let it run for a few seconds.
We then caused a fatal event (^C in this case) to
occur that caused all processing to stop. When the threads are
dependent on each other as they are in this example, it
can be very difficult to determine where the first problem occurred.
We cover the following basic TimeTrac functions:
TimeTrac Output - Stopped Execution, Case #1 |
Return to Top | ||
|
If we run this program for a few seconds and then stop it with a ^C
(before the counter reaches 500),
it will create several files with the .trc
extension. If we then run TimeTrac, we will see a display similar to the following below.
In this case we have a main thread with two events instrumented,
multiple threads each with multiple events instrumented, and an output
thread (vsum) with a single event instrumented.
The vsum thread must wait for the completion
of the Compute threads before starting. In this example, the main thread manages
that synchronization.
In this example, we have been running for a few seconds and the application stopped. The TimeTrac output appears as: |
|||

|
|||
| We have installed a trap handler to catch the ^C and dump the TimeTrac trace files. TimeTrac indicates that the application is no longer running. | |||
TimeTrac Output -- Tail End of TimeTrac Output |
Return to Top | ||
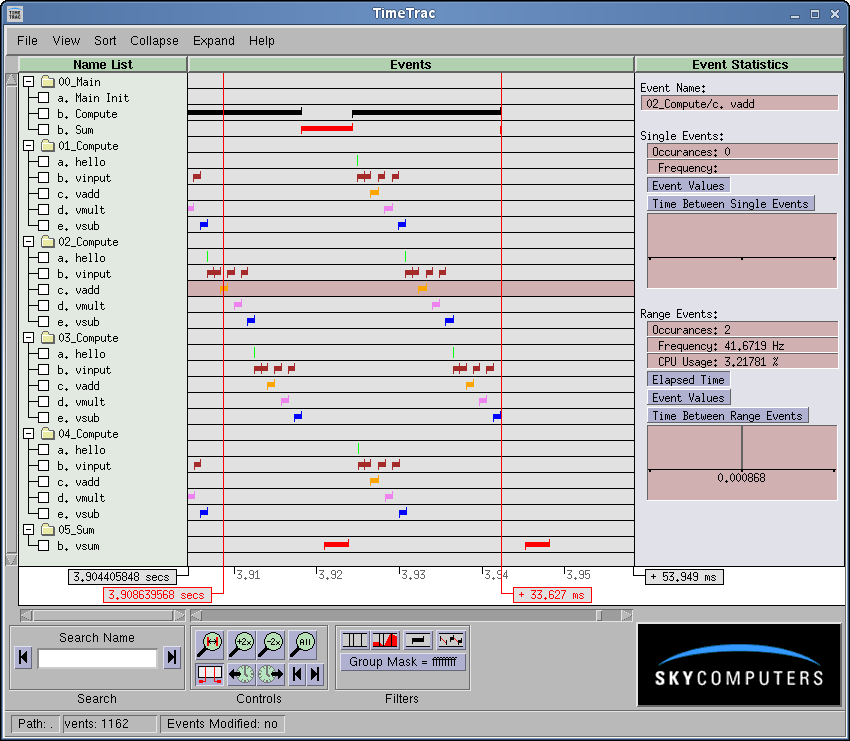
| We have simulated an application where one or more threads have gone off "into the weeds". What happened? We need to look at the end of the TimeTrac output: | |||

|
|||
| This application has threads that are dependent on the main thread for commands at each step of the way. In this instance, a ^C caused the main thread to stop executing; the compute threads continued until each finished its assigned task. Then these threads also stopped (they are waiting for input from the main thread). TimeTrac readily shows the which thread caused the entire application to stop. | |||
|
We can also see the same thing from the event box for the main thread. In the main thread, the Compute function started but never completed. Therefore, the problem occurred between the Compute start and the Compute end TimeTrac calls. Note that each of the Compute threads continued until they competed their assigned task. |
|||

|
|||
TimeTrac Output -- What Happened Last, Case #2 |
Return to Top | ||
|
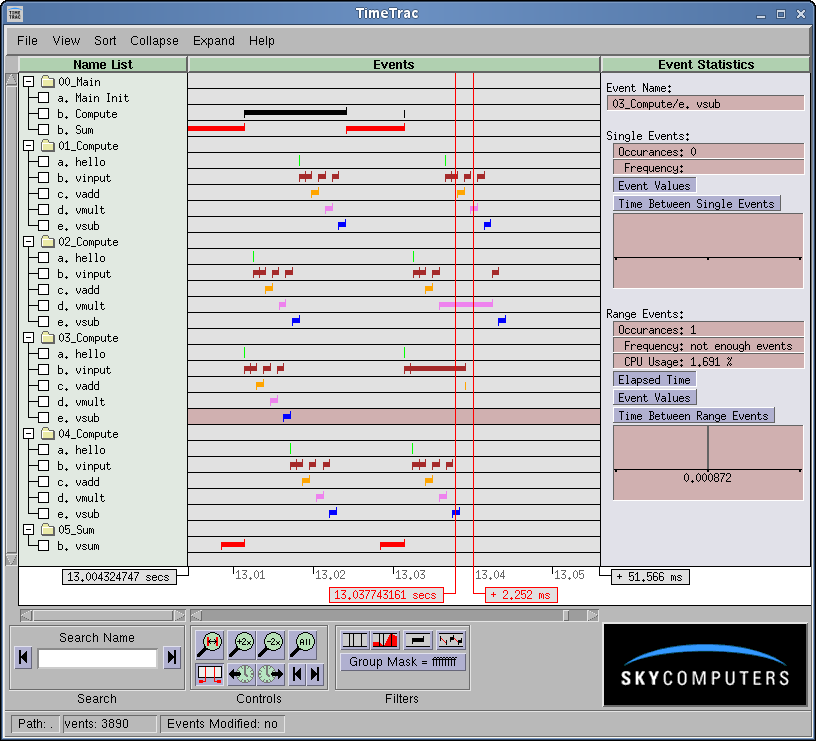
If we let the application run longer before stopping it, we once again have gone off "into the weeds" (notice that the counter has stopped incrementing). What happened this time? Again we need to look at the end of the TimeTrac output: |
|||

|
|||
| In this case one of the threads stopped executing. The TimeTrac traces show that the vadd function for thread of rank #3 started but never returned. There is an artificial bug where rank #3, starts the vadd function but never returns on pass #555 (you can see this if you hold the shift key and left click on one of the last events). With TimeTrac, the offending module can be readily identified. | |||
Source Code |
Return to Top |
| Module | TimeTrac Functions |
|---|---|
| wh_main.c | All calls -- TimeTrac User Guide |
| wh_compute.c | All calls -- TimeTrac User Guide |
| wh_sum.c | All calls -- TimeTrac User Guide |
| ex_alloc.c | No TimeTrac calls |
| ex_math.c | No TimeTrac calls |
| ex_misc.c | No TimeTrac calls |
| sky_ex_inc.h | See time_trac.h |
| wh_tcb.h | No TimeTrac calls |
What Happened Last Summary |
Return to Top | ||
|
This example shows the last events that occurred prior to an unexpected application hang.
|
|||
| Previous | Return Intro | Return to Top | Next |